Mr. Dashboard – Business Manager
Includes 4 bundles:
1. The Excel4Marketing Best Seller
Excel4Marketing Toolbox for Microsoft Excel
Excel4Marketing Tools for Marketing Management, Analysis and Strategy for business users of Microsoft Excel
The Excel4Marketing product features:
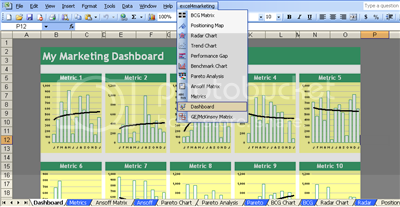
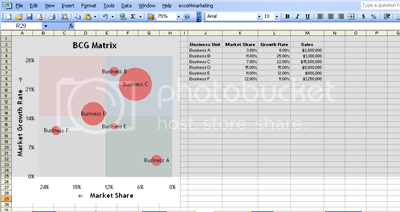
* BCG Matrix
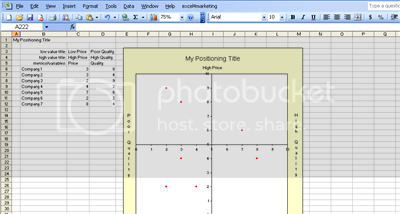
* Perceptual Mapping / Positioning Maps
* Marketing Metrics and Dashboard Report
* Benchmarking
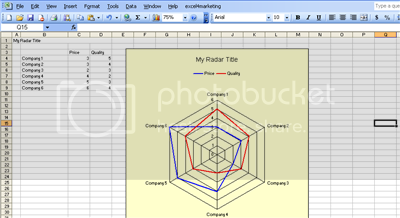
* Radar Charting
* Performance Gap Analysis
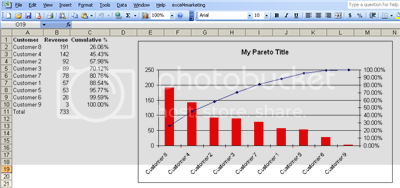
* Pareto Analysis and Pareto Charting
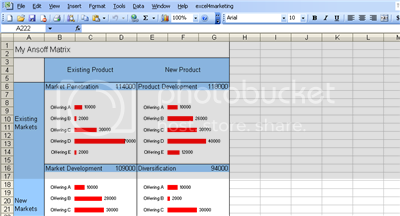
* Ansoff Matrix
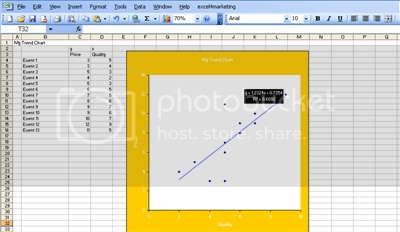
* Trend Chart
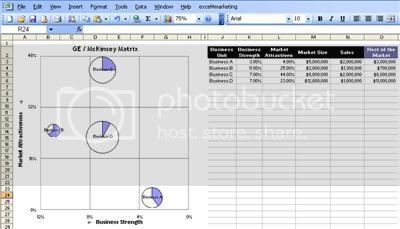
* GE / McKinsey Matrix
2. Mr. Dashboard Financial Dashboard for Excel
Financial Dashboard Product is an Application for Financial Analysis and Reporting for Microsoft Excel. This product includes three Financial Statement Templates (Income Statement, Balance Sheet, and Cash Flow Statement), One-Page Executive style Financial Dashboard Report, Financial Ratios Dashboard Report with your business financial ratios, and DuPont Analysis Dashboard Template. All Excel Dashboard Reports are fully automated to calculate and report your key financial ratios / metrics based on your financial statements for the last 5 years.
The Financial Ratios Dashboard includes the 36 most frequently used financial ratios / metrics in financial planning, financial reporting and financial analysis. Each of these 36 key financial ratios in the dashboard offers easy to analyze and report financial summary, chart, and trend indicators. The one-page Executive style Financial Dashboard Report shows your financial performance trends for the 25 most critical financial information used in financial analysis and reporting. The DuPont Analysis Dashboard updates and visually explains the relationships among the financial metrics used in DuPont analysis.
With Mr. Dashboard Financial Dashboard for Excel product you can have best in class financial analysis and reporting in Microsoft Excel and get an excellent business insight without wasting any additional time and effort. This easy to use product allows you to print professional magazine quality financial reports and simplifies your financial analysis and reporting.
3. EXCEL DASHBOARD BUNDLE
Excel Dashboard Bundle includes three best in class Excel Dashboard Products for Microsoft Excel users:
– Excel Dashboard
– Interactive Excel Dashboard
– Excel Speedometer Dashboard
3.1 ONE-PAGE MAGAZINE QUALITY EXCEL DASHBOARD
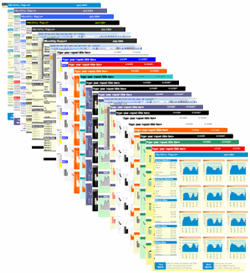
Mr. Dashboard Excel Dashboard is an Excel Dashboard Application / Templates for Microsoft Excel users. This Excel Dashboard Product includes 10 one-page Excel Dashboard Reports designed to give you an excellent business insight into your business by using one-page executive style reporting. These Excel Dashboard Templates have excellent print quality – perfect for your business reporting, analysis and effective communication on your meetings with employees, customers and suppliers. Each Excel Dashboard Report Template updates automatically based on your data in Excel. You have 10 different Excel Dashboard Report Templates but you can easily make custom report changes and create your own Excel Dashboard reports.
For the most effective business insight these Excel Dashboard Templates use 13-month scale so you can continuously track your Business Metrics and Trends over the last 13 months. Whether you need Executive Reports, Financial Reports, Sales Dashboard, Operational Reports, Marketing Scorecard or any other Business Report this is a product you can use and customize on a daily basis. This easy to use product works in one Excel file where you have your business data and use the best in class magazine quality Excel Dashboard Reports to generate different business reports, analysis and presentations.
Now you can see your business on one page in a few minutes! You can purchase and download this product in a few moments and see your business like never before!
3.2 Dynamic and Interactive Best in Class Excel Dashboard Reporting
Our Best Seller: Mr. Dashboard Interactive Excel Dashboard is a Dynamic and Interactive Excel Dashboard Application for Microsoft Excel users. This best selling product bundle is a collection of more than 20 unique magazine quality one-page Excel Dashboard Report Templates. Each of these Excel Dashboard Report Template updates automatically based on your Excel data so your Business Reports are always ready for business analysis, reporting, meeting and presentations. With this easy to use product for Microsoft Excel you can create your Excel Dashboard Reports in a minute. You can also easily customize your Excel Dashboard Reports based on your business reporting requirements.
All Excel Dashboard Reports can be drilled down and analyzed for different time periods – offering you different business insight and perspectives on your business. This product can be used by anyone – whether you are an experienced excel user or a beginner you can create your best in class professional Excel Dashboard Reports immediately.
With Mr. Dashboard Interactive Excel Dashboard product you will get a powerful Excel Dashboard Reporting Tool with dynamic and custom views of your business data. With a click of a button and in less than one minute you can create many different reports with different views of your data. User friendly drop down features allows you to see your data for different time periods. You can work with large data and satisfy different business reporting needs as they arise. With a click of a button you can update your charts and create charts with any scale you need – for example you can see your data for the last two or three periods or for 20-30 periods in a second – you can customize your Excel Dashboard reports for as many periods as you want. This application has been used for creating financial, operational, marketing, sales, six sigma and many other business applications because you can continuously track and analyze your business information per hour, shift, day, week, month, etc. This is best in class business reporting product for your business analysis, reporting, meetings and presentations. This is a product you will use on a daily basis and it will save you a lot of time and give you executive style – magazine quality business reports.
Now you can see your business on one page in a few minutes! You can purchase and download this product in a few moments and see your business like never before!
3.3 Mr. Dashboard Interactive Speedometer Dashboard
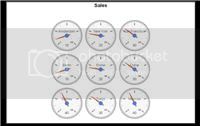
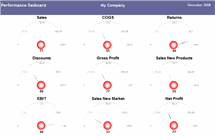
This Interactive Excel Dashboard Application gives you excellent visual insight into your business by presenting your KPIs in the most flexible and easy to analyze way. With a click of a button you can dynamically track and analyze your business performances and view them as dashboard gauges in Microsoft Excel. Understanding and Analyzing your Business Metrics have never been easier. The dashboard screen has nine gauges for your most critical business metrics. Since this is an Excel Dashboard Application it is very easy and free to have more than one Speedometer Dashboard in a few minutes by saving the Excel file with different names and changing/updating your business data. You just need to have your data in Excel and you will be able to see your business information at a glance. Drop down option allows you to change the view of your business data in a second for different time periods, different locations, or any customized setup of your business information.
4. Quality Management Software for Microsoft Excel
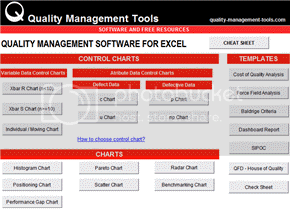
Quality Management Toolbox for Excel is an Easy to Use Excel Application for Quality Management Professionals and it’s a great tool for any Quality Management and Six Sigma Projects. All Statistical Quality Control Charts are fully automated so users can create any control chart with a click of a button in Microsoft Excel.
This product includes the following quality management tools:
* X bar & R Chart
* X bar & Chart
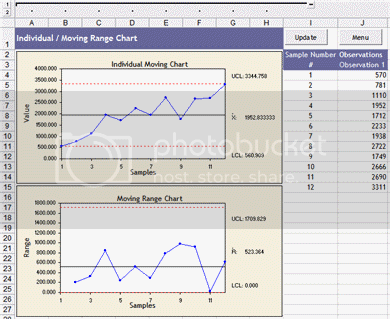
* Individual / Moving Chart
* c Chart
* u Chart
* p Chart
* np Chart
* Histogram Chart
* Pareto Chart
* Radar Chart
* Performance Gap Chart
* Positioning Chart
* Scatter Chart
* Benchmarking Chart
* Cost of Quality Analysis
* Force Field Analysis
* Baldrige Scorecard
* One-page Dashboard Report
* SIPOC
* House of Quality
* Check Sheet
* Fishbone Diagram (Cause and Effect Diagram)
Get download Mr. Dashboard – Business Manager at coursesblock.com right now!
Delivery Method
– After your purchase, you’ll see a View your orders link which goes to the Downloads page. Here, you can download all the files associated with your order.
– Downloads are available once your payment is confirmed, we’ll also send you a download notification email separate from any transaction notification emails you receive from coursesblock.com
– Since it is a digital copy, our suggestion is to download and save it to your hard drive. In case the link is broken for any reason, please contact us and we will resend the new download link.
– If you cannot find the download link, please don’t worry about that. We will update and notify you as soon as possible at 8:00 AM – 8:00 PM (UTC 8).
Thank You For Shopping With Us!





![[Download Now] Charm Offensive – Inspiring Influence](https://coursesblock.com/wp-content/uploads/2024/10/Charm-Offensive-Inspiring-Influence-imc-1-300x300.png)

