[Download Now] Wyckoff Analytics – Projecting Point-And-Figure Price Targets Across Multiple Time Frames – PnF Part II
PLEASE CHECK VIDEO OF ALL CONTENTS : WATCH HERE!

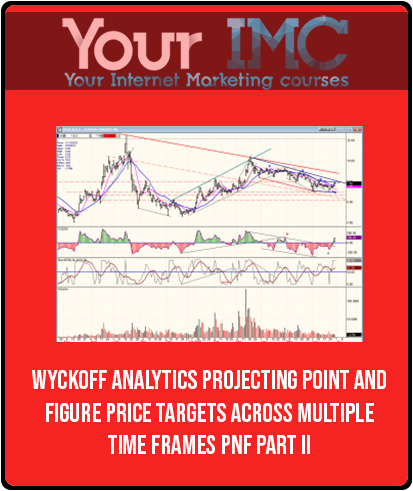
Wyckoff Analytics – Projecting Point-and-Figure Price Targets Across Multiple Time Frames – PnF Part II
Among Richard Wyckoff’s many contributions to technical analysis is his unique method of estimating price targets using his Second Law of “Cause and Effect,” in which the horizontal Point and Figure (P&F) count in any trading range represents the Cause and the subsequent trending price movement the Effect. Like many other phenomena in trading, Wyckoff’s Second Law is fractal, and can be profitably deployed in any time frame.
In Part II: Projecting Point-and-Figure Price Targets Across Multiple Time Frames, Bruce Fraser and Roman Bogomazov provide detailed instructions on how to create and use Wyckoff-based P&F charts to estimate realistic price targets. Anyone who has seen Bruce’s P&F analyses knows how, when properly done, this technique can identify future price objectives with uncanny accuracy.
This course builds on the methodological foundations presented in our on-demand P&F Part I: Setting Price Targets Using Wyckoff Point-and-Figure Projections. However, Part II is based on entirely new material. Bruce and Roman present several of their advanced refinements of this technique, including some that they have never made public before. Traders who purchased Part I will gain new practical insights as well as a much deeper understanding of this approach.
Each of the three sessions in Part II is devoted to a specific time frame:
~Long-term campaigns [months to years],
~Swing trades [weeks to months], and
~Intraday [hours to days]).
Bruce and Roman present the materials as case studies that start with a blank P&F chart and then, as the chart unfolds over time, show you their step-by-step process for taking and projecting horizontal counts.
In this webinar series, they demonstrate — for the first time — how to analyze the directional bias of a trading range based on P&F analysis alone, as well as how to enhance the quality of your P&F analysis by incorporating trading volume. They introduce new concepts through the case studies, and revisit the fundamentals of P&F horizontal counting, including how to:
~Create and annotate Wyckoff-style P&F charts
~Correctly identify the count line in a variety of trading range configurations
~Designate P&F phases sequentially and project price targets from each
~Anticipate the resumption of a trend based on confirming counts of re-accumulation and re-distribution trading ranges
~Manage trades once price approaches P&F-based price targets
There is no prerequisite for Part II: Projecting Point-and-Figure Price Targets Across Multiple Time Frames, but we highly recommend that you start your P&F education with the on-demand P&F Part I
Each of the three videos in Part II has an accompanying handout of their slides, which can be printed out to allow you to take notes on as you watch the presentations. You will have one full year from the date of purchase to view and review the videos!
Delivery Method
– After your purchase, you’ll see a View your orders link which goes to the Downloads page. Here, you can download all the files associated with your order.
– Downloads are available once your payment is confirmed, we’ll also send you a download notification email separate from any transaction notification emails you receive from coursesblock.com.
– Since it is a digital copy, our suggestion is to download and save it to your hard drive. In case the link is broken for any reason, please contact us and we will resend the new download link.
– If you cannot find the download link, please don’t worry about that. We will update and notify you as soon as possible at 8:00 AM – 8:00 PM (UTC 8).
Thank You For Shopping With Us!